1. INTRODUCTION
It is well known that the medicinal plant hawthorn i.e., Crataegus monogyna Jacq. (Lindm) or C. laevigata (Poir.) D.C., Rosaceae, is an excellent source of naturally occurring and biologically multi-active (cardiotonic, anti-arrhythmic, hypotensive, hypolipidemic, anti-inflammatory, gastro-protective, free-radical-scavenging and somewhat antimicrobial) valuable secondary metabolites, such as various flavonoids and phenolcarboxylic acids (Gheitasi et al., 2022; Li et al., 2022; Lin and Harnly, 2007; Lund et al., 2020; Tadić et al., 2008).
Numerous scientific studies suggest that the consumption of plants abundant in various phenolics may significantly contribute to human health. Over the last few decades, many publications on the analysis of plants phenolics have already appeared. Unfortunately, there is still neither a standardized extraction procedure for sample preparation/handling, nor general analytical methods available, including many variations of High Pressure/Performance Liquid Chromatography (HPLC) currently used to determine all beneficial polyphenols in a single step. Therefore, the need for better systematic approaches persists, and many researchers are impatiently striving to develop more and more robust analytical procedures for simultaneous determination of important subclasses of polyhydroxy aromatics (Lund et al., 2020; Orhan, 2019; Sagaradze et al., 2019).
At present, hawthorn extracts (from Craetegus sp.) are used for the treatment of declining cardiac performance, classified by the New York Heart Association (NYHA) as stages I and II. Based upon long-standing traditional usage, Crataegus spp., folium cum flore has been utilized to relieve symptoms of temporary nervous cardiac complaints (e.g. palpitations, perceived extra heart beat due to mild anxiety) after serious conditions have been excluded (European Medicines Agency - EMA/HMPC, 2016). Dried flowering tops, flowers, leaves and fruits are taken/considered as crude drugs. Most often, medicinally used species are C. monogyna Jacq. (Lindm) and C. laevigata (Poir.) D.C., Rosaceae, while less frequently are C. pentagyna, C. nigra and C. azarolus L. (Cui et al., 2024; Lu et al., 2023; Popovic-Milenkovic et al., 2014; Turnalar Ülger et al., 2023; Wang et al., 2011). Hawthorn species contain flavonoids, procyanidins and (-) epicatechin, and there are qualitative and quantitative differences in the flavonoid composition in the flowers, leaves and fruits of each species. The main flavonoids found in Crataegus species are flavonol-O-glycosides, such as hyperoside, flavone-3¬glycosides, like vitexin-2"-O-rhamnoside, as well as acetylvitexin-2"-O-rhamnoside (Tadić et al., 2008). Procyanidins, or condensed tannins, as flavan-3-ol oligomers and/or polymers, create a separate group of flavanoids, and are classified as the type A or B, depending on their interflavonoid linkages. In addition, hawthorn contains phenylpropanoids - phenolic carboxylic acids, such as a chlorogenic and a caffeic one.
Furthermore, the flavonoid glycosides are quantified in both the German and Swiss Pharmacopoeia, using the hydrolysis procedure, and expressing the overall quantity of flavonoids as hyperoside content by the photometric method ( DAB 10, 1991). The composition data on phenolic acids, among Crataegus sp., are also insufficient, and the concentrations of different phenolics in hawthorn extracts are largely unknown. Once again, quantitative separations of phenolic compounds are needed to obtain their exact concentrations, but the polyphenols themselves interfere with the HPLC technology, therefore, in many cases, the additional sample “clean-up” procedures are unavoidable (Brown and Lister, 2014; Naczk and Shahidi, 2004).
In a continuation of our research, we have developed and validated a relatively simple, but very reliable, one-step qualitative/quantitative HPLC analysis of four key flavonoids, such as quercetin, isoquercitrin, hyperoside, vitexin and a phenolcarboxylic acid, chlorogenic acid.
For sample preparations, either triple percolations, using 70% ethanol-water (V/V) (the method used in the cardiotonic product Forticor® capsules, a trade mark in Serbia), or/and ultrasonic bath methanol extractions (as one of the methods commonly applied in investigation of plant extracts), were carried out to obtain the desired isolates. The new all-around procedure, including HPLC analyses, is already being applied to check the quality of the commercially used cardiotonic Forticor®, intended for strengthening cardiac muscles, to lower the risks of atherosclerosis, hypertension, and congestive heart failure.
2. MATERIALS AND METHODS
2.1. Plant extracts
Crataegus raw materials were obtained from the Pomoravlje region, Serbia, where plants are grown according to the principles of Good Agricultural Practice (GAP), while the extracts were produced according to Good Laboratory Practice (GLP). The plant materials were dried, at room temperature, in dark places. All the specimens, namely cm250609 and cl250609 (hawthorn leaf/flower) and cmb110909 and clb110909 (hawthorn berries) were deposited/kept at a Herbarium of Jevremovac Botanical Gardens, Belgrade.
2.2. Re-percolation of hawthorn samples
Dry plant materials were grinded to the size of 180 meshes, and put into percolation devices. Hawthorn leaf/flower (R-HLF) and hawthorn berry extract (R-HB) extracts were obtained by triple percolation with 70% ethanol, at a drug/solvent ratio of 1:1. After all extractions, liquids were evaporated, yielding 15.8 % and 10.5% (w/w) residues, expressed relatively as “dried” starting materials. Such obtained dry extracts (0.05 g of R-HLF and 0.55 g of R-HB, respectively) were dissolved in 10 mL methanol, then filtered through 0.2 μm PTFE syringe filters into glass HPLC vials, and later on analyzed, as described further in the text. These experiments were being repeated for five times, over the periods of three days.
2.3. Ultrasonic extraction of hawthorn plant samples and Forticor capsules content
Dry hawthorn leaf/flower (E-HLF, 0,51 g) and hawthorn berry (E-HB, 2.20 g) plant materials were grinded to the size of 180 meshes and extracted with 10 mL of methanol in ultrasonic baths, during 60 minutes. Forticor capsules homogenized content (grinded to 180 mesh, 450 mg each, on average) were also extracted, but with 50 mL of methanol in ultrasonic baths, during 60 minutes too. After extractions, all plant/Forticor samples were filtered through 0.2 μm PTFE syringe filters into glass HPLC vials, and later on analyzed, as described further in the text. These experiments were being repeated for five times, over the periods of three days.
2.4. Chemicals and reagents
HPLC grade acetonitrile, 85 % orthophosphoric acid and methanol were purchased from Merck (Darmstadt, Germany). All commercially available phenolic reference standards were obtained from Carl Roth (Karlsruhe, Germany). Their purity was declared as follows: chlorogenic acid > 98%, vitexin > 99%, hyperoside > 99%, isoquercitrin > 99% and quercetin > 99%, based on the manufacturer’s internal high-precision HPLC method. For the long-term preservation, and to make sure they are to remain reliable, all standards were kept in desiccators and stored in a freezer, always protected from the oxygen and any kind of light(s).
2.5. Preparation of standards and creation of calibration curves
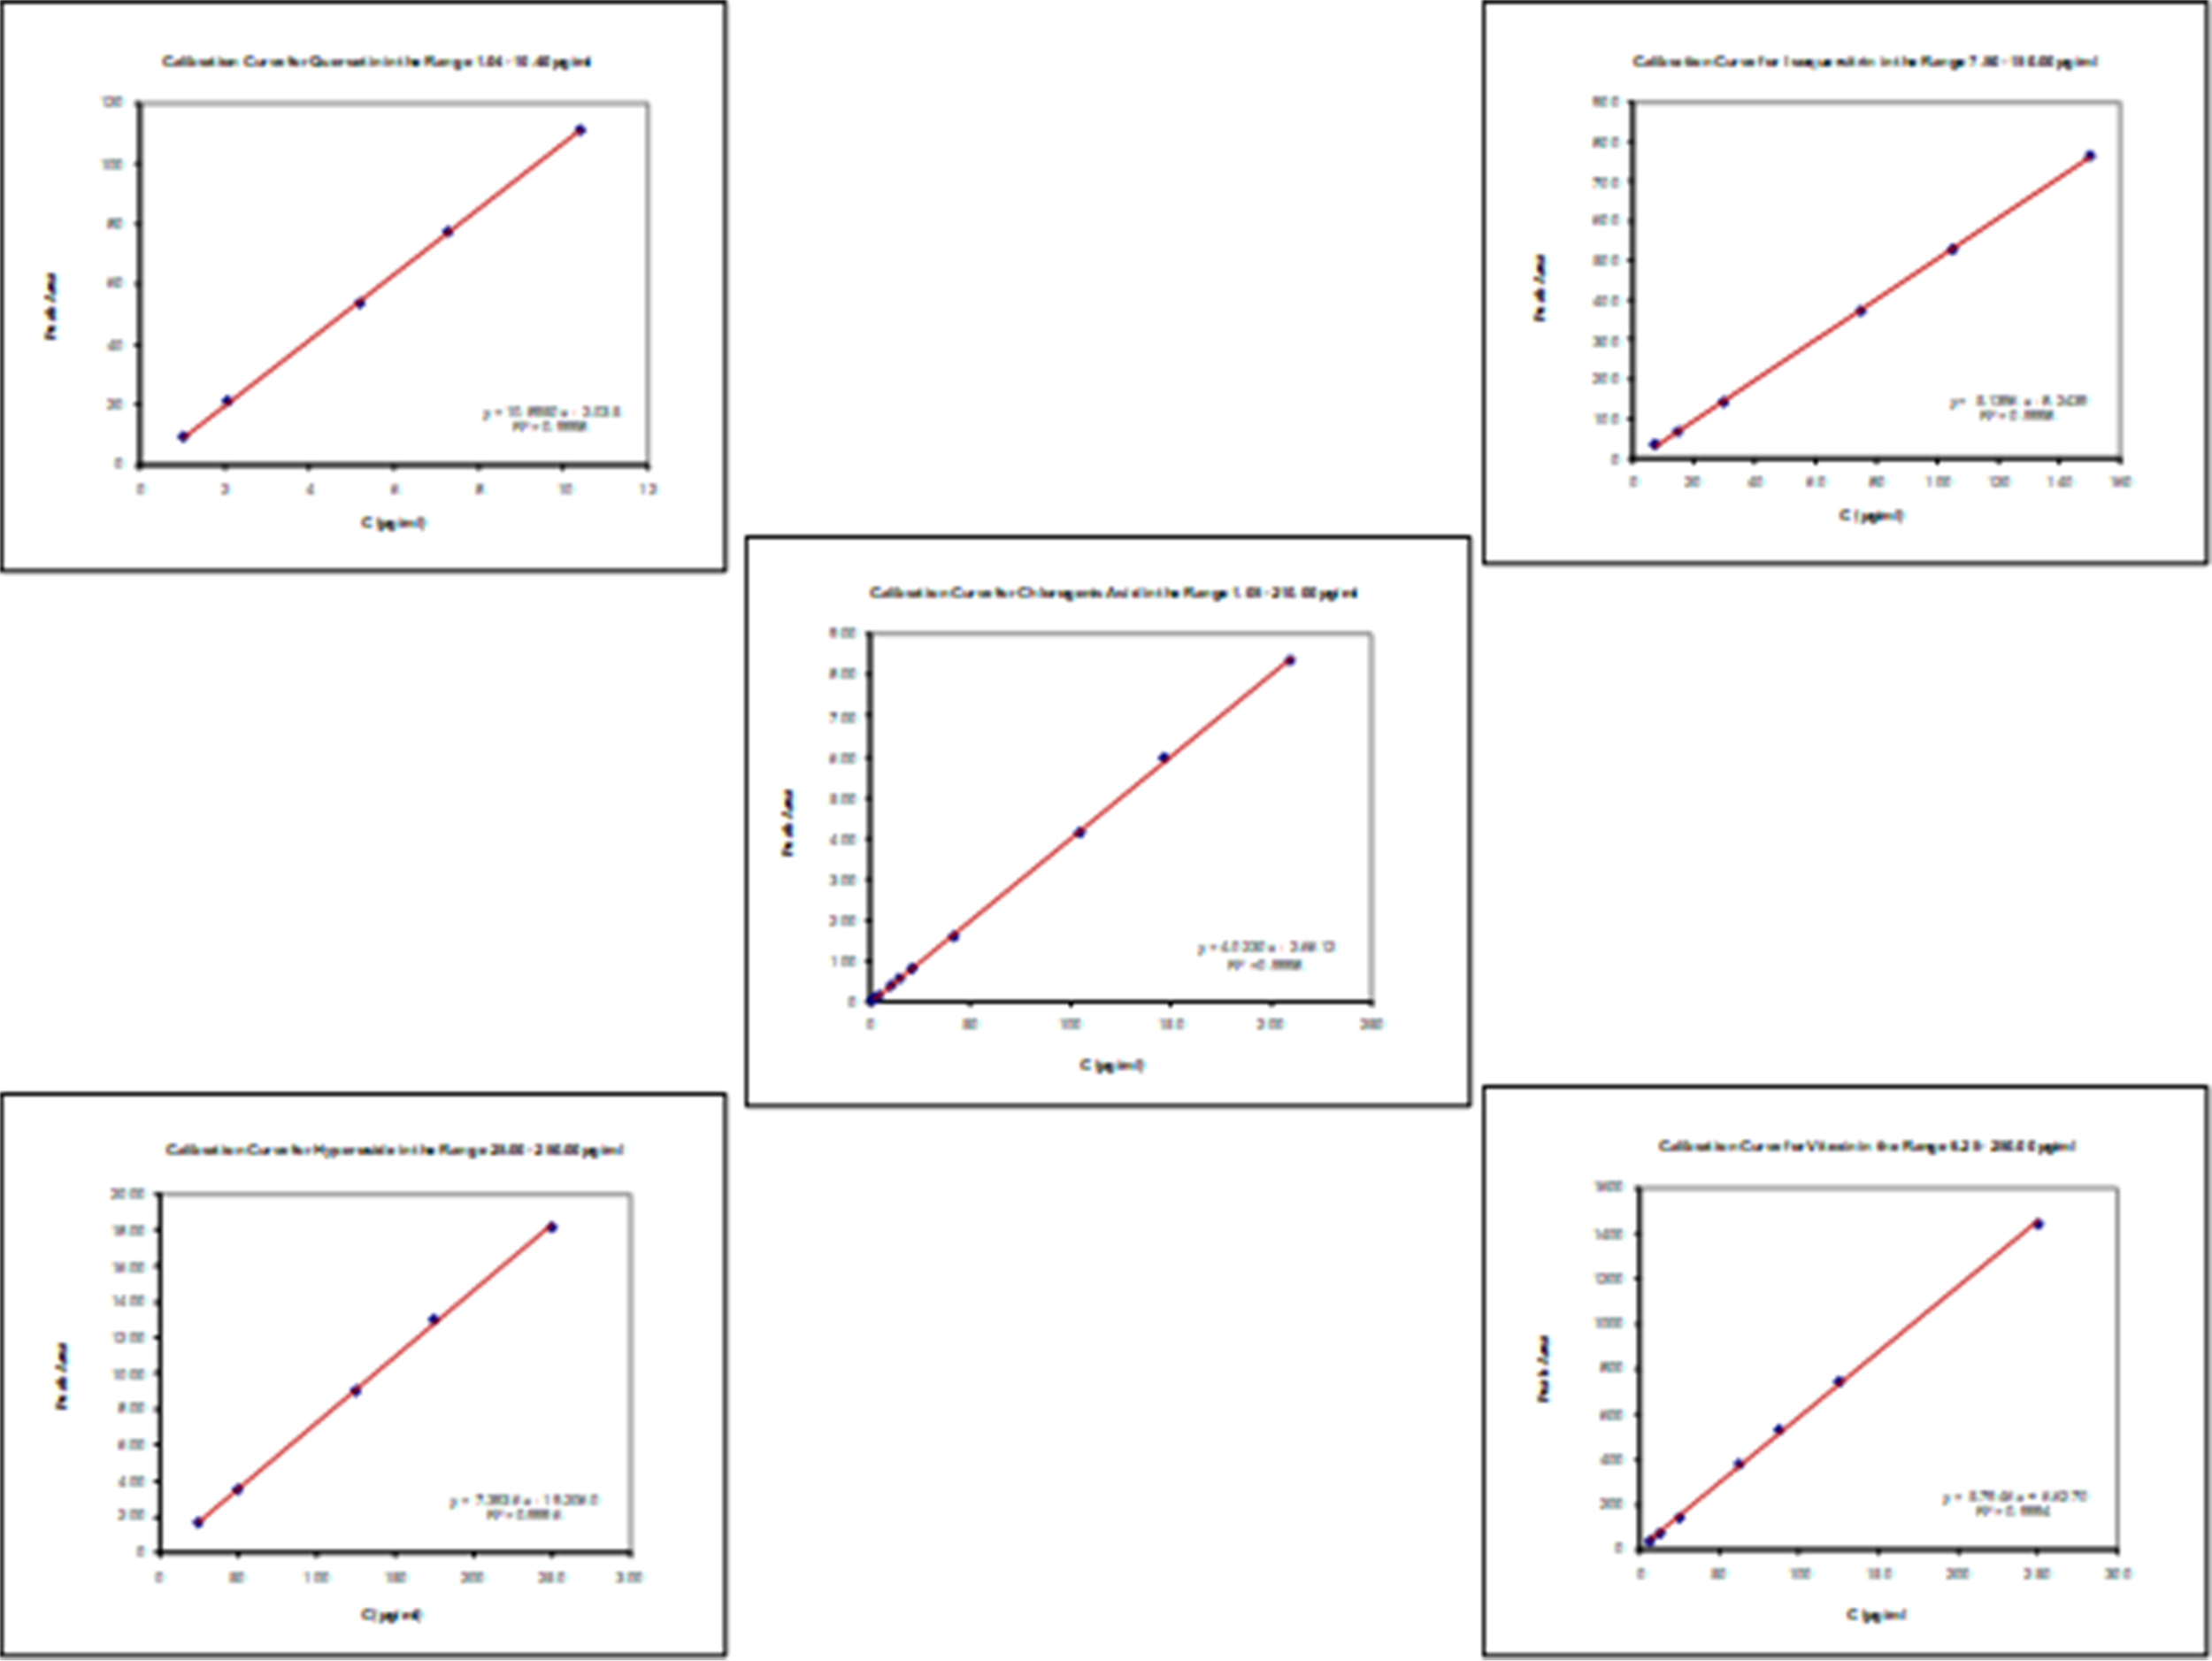
Pure chlorogenic acid, vitexin, hyperoside, isoquercitrin and quercetin, were used for a gradual dissolution in methanol (the approximate amounts were 2.1, 2.5, 2.5, 1.5 and 0.1 mg, respectively) into 10.0 mL volumetric flasks, followed by methanol dilutions in order to prepare final chemical standard solutions for the creation of calibration curves at target concentrations ranged 1.05 - 210.00, 6.25 - 250.00, 25.00 – 250.00, 7.50 – 150.00 and 1.04-10.40 μg/mL, respectively. The equations were ascertained by using a sample linear regression, while the correlation factor for each of the curves was calculated. The actual concentrations were expressed as percentage contents, corrected only for the impurities of the standards, as being declared by the fine chemical supplier. To ensure a complete linearity, calibration curves were always being visually inspected as well. Most relevant data are shown in Figure 2 and Table 1.
| Samples | Analyzed | Phenolic content (mg/g of dry matter) | RSD (%) |
|---|---|---|---|
| R-HLF | Chlorogenic acid | 14.8 | 1.37 |
| Vitexin | 18.1 | 1.66 | |
| Hyperoside | 10.6 | 1.08 | |
| Isoquercitin | 9.5 | 0.65 | |
| Quercetin | 0.8 | 2.08 | |
| E-HLF | Chlorogenic acid | 3.4 | 1.25 |
| Vitexin | 3.1 | 1.22 | |
| Hyperoside | 2.5 | 1.82 | |
| Isoquercitin | 2.2 | 0.43 | |
| Quercetin | 0.1 | 0.71 | |
| R-HB | Chlorogenic acid | - | - |
| Vitexin | 0.1 | 1.8 | |
| Hyperoside | 1.2 | 0.91 | |
| Isoquercitin | 0.8 | 0.88 | |
| Quercetin | 0.1 | 1.81 | |
| E-HB | Chlorogenic acid | - | - |
| Vitexin | - | - | |
| Hyperoside | 0.3 | 0.32 | |
| Isoquercitin | 0.2 | 0.17 | |
| Quercetin | - | - | |
| Forticor capsules | Chlorogenic acid | 17.1 | 0.35 |
| Vitexin | 45 | 0.18 | |
| Hyperoside | 14.7 | 0.41 | |
| Isoquercitin | 12.4 | 0.79 | |
| Quercetin | 1.7 | 0.07 |
2.6. HPLC analyses
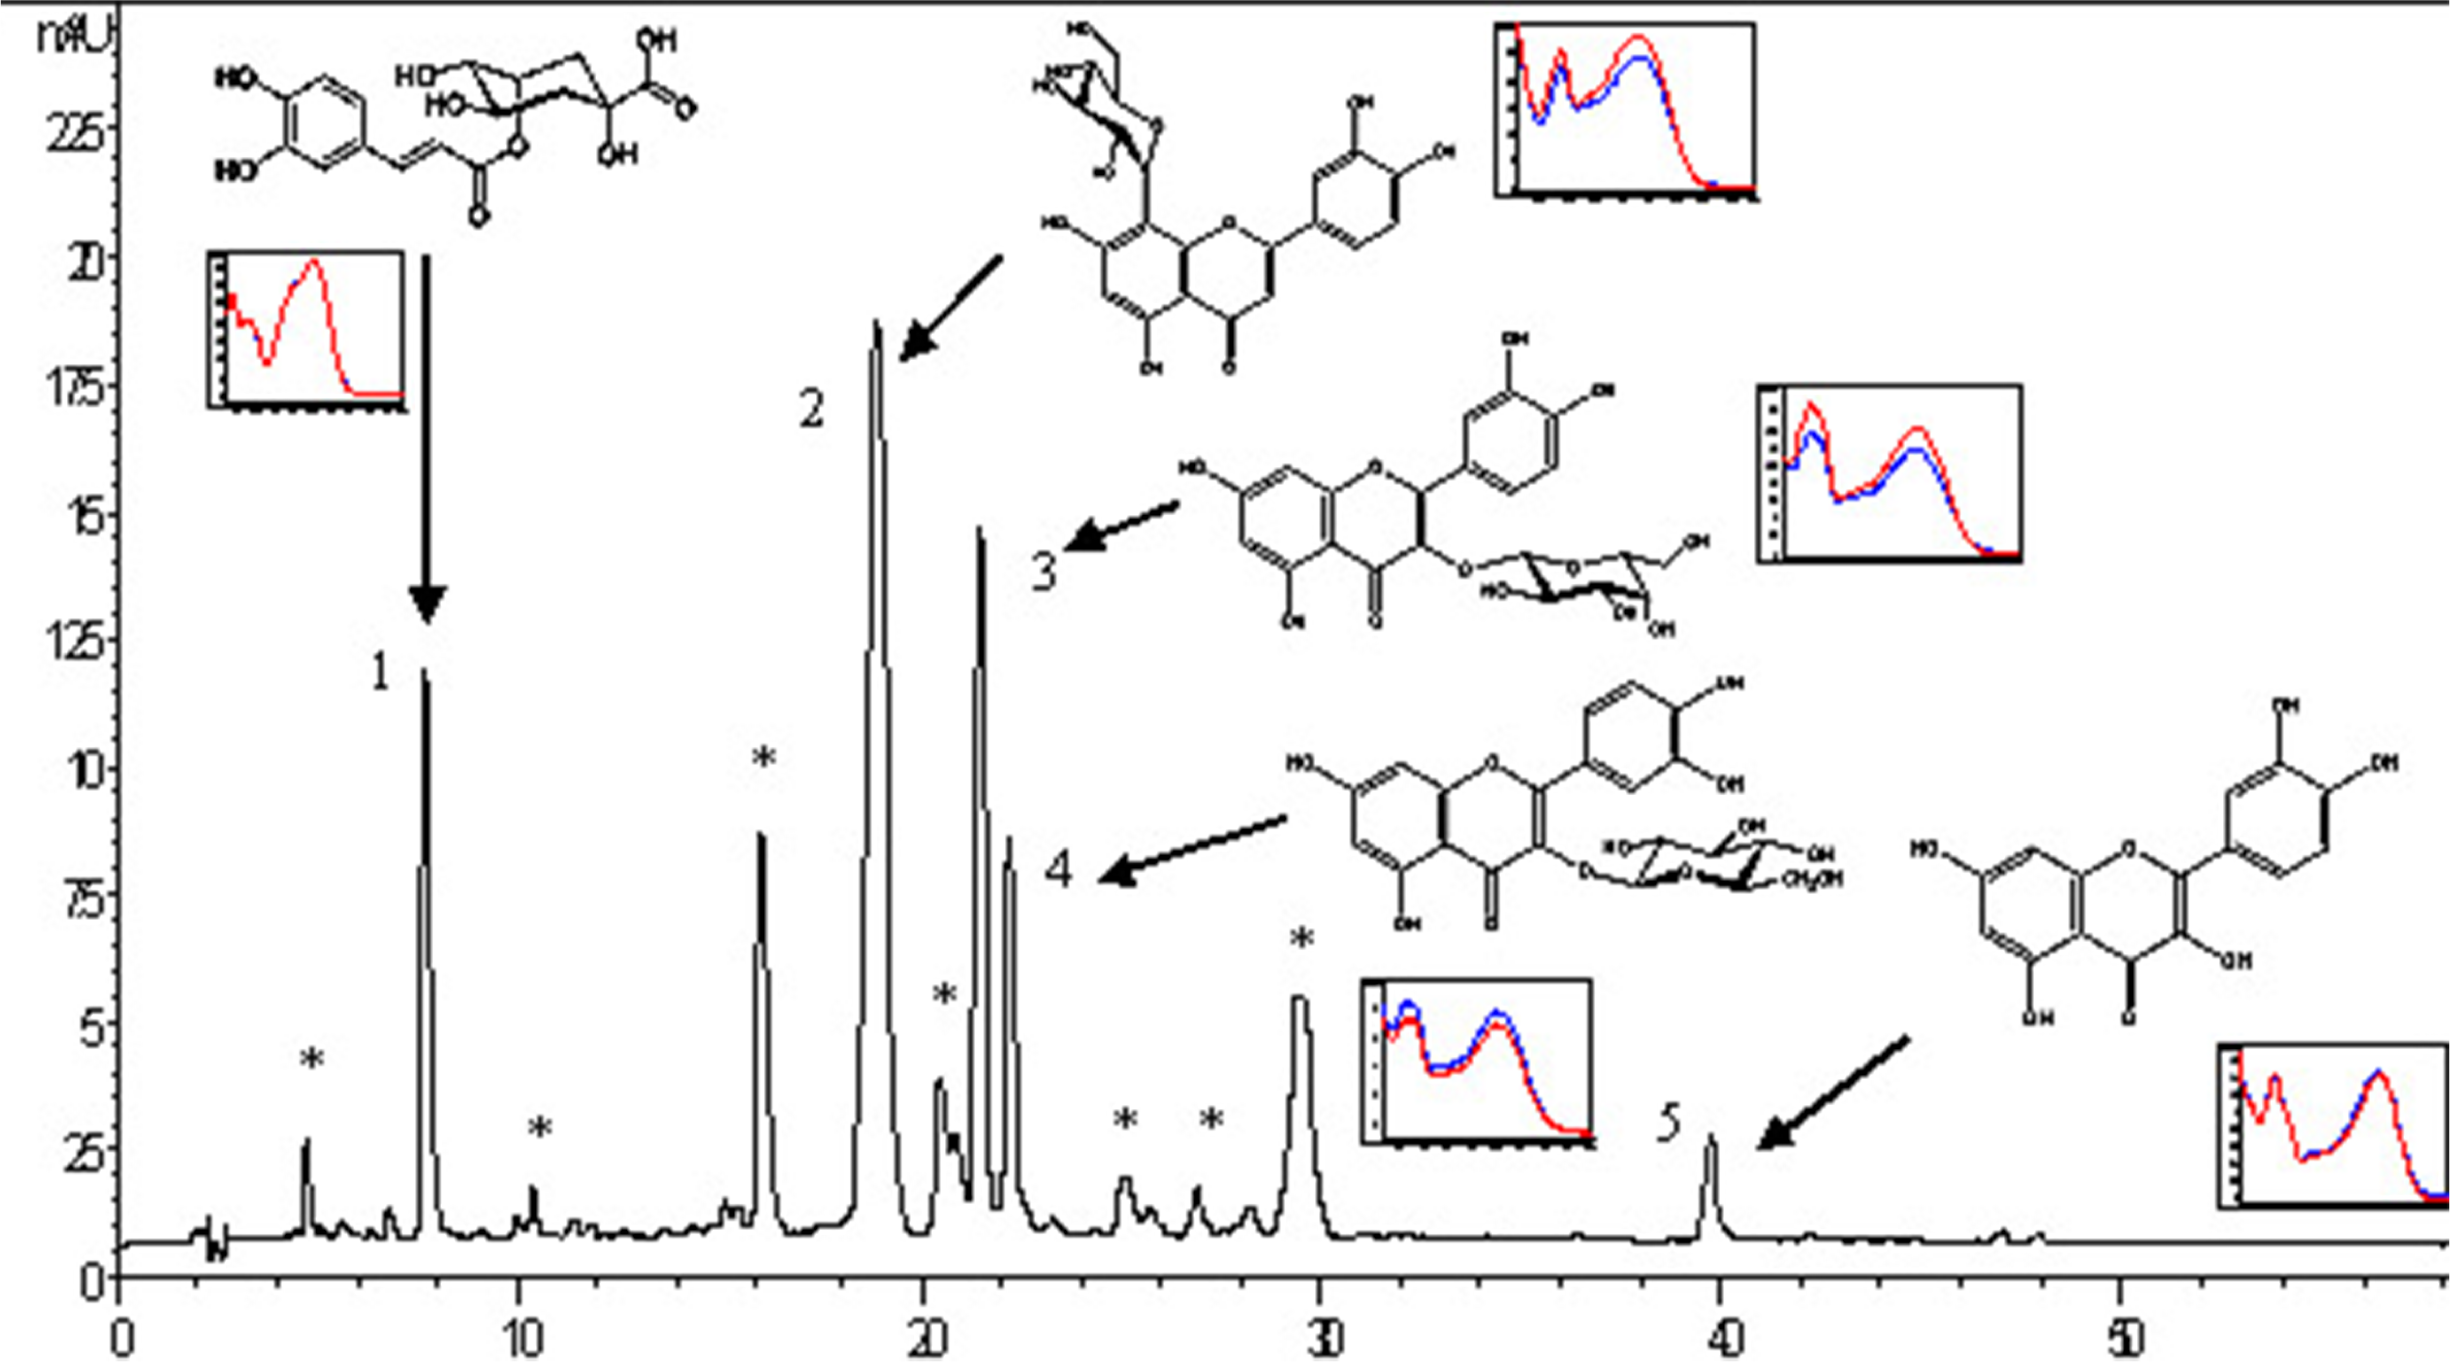
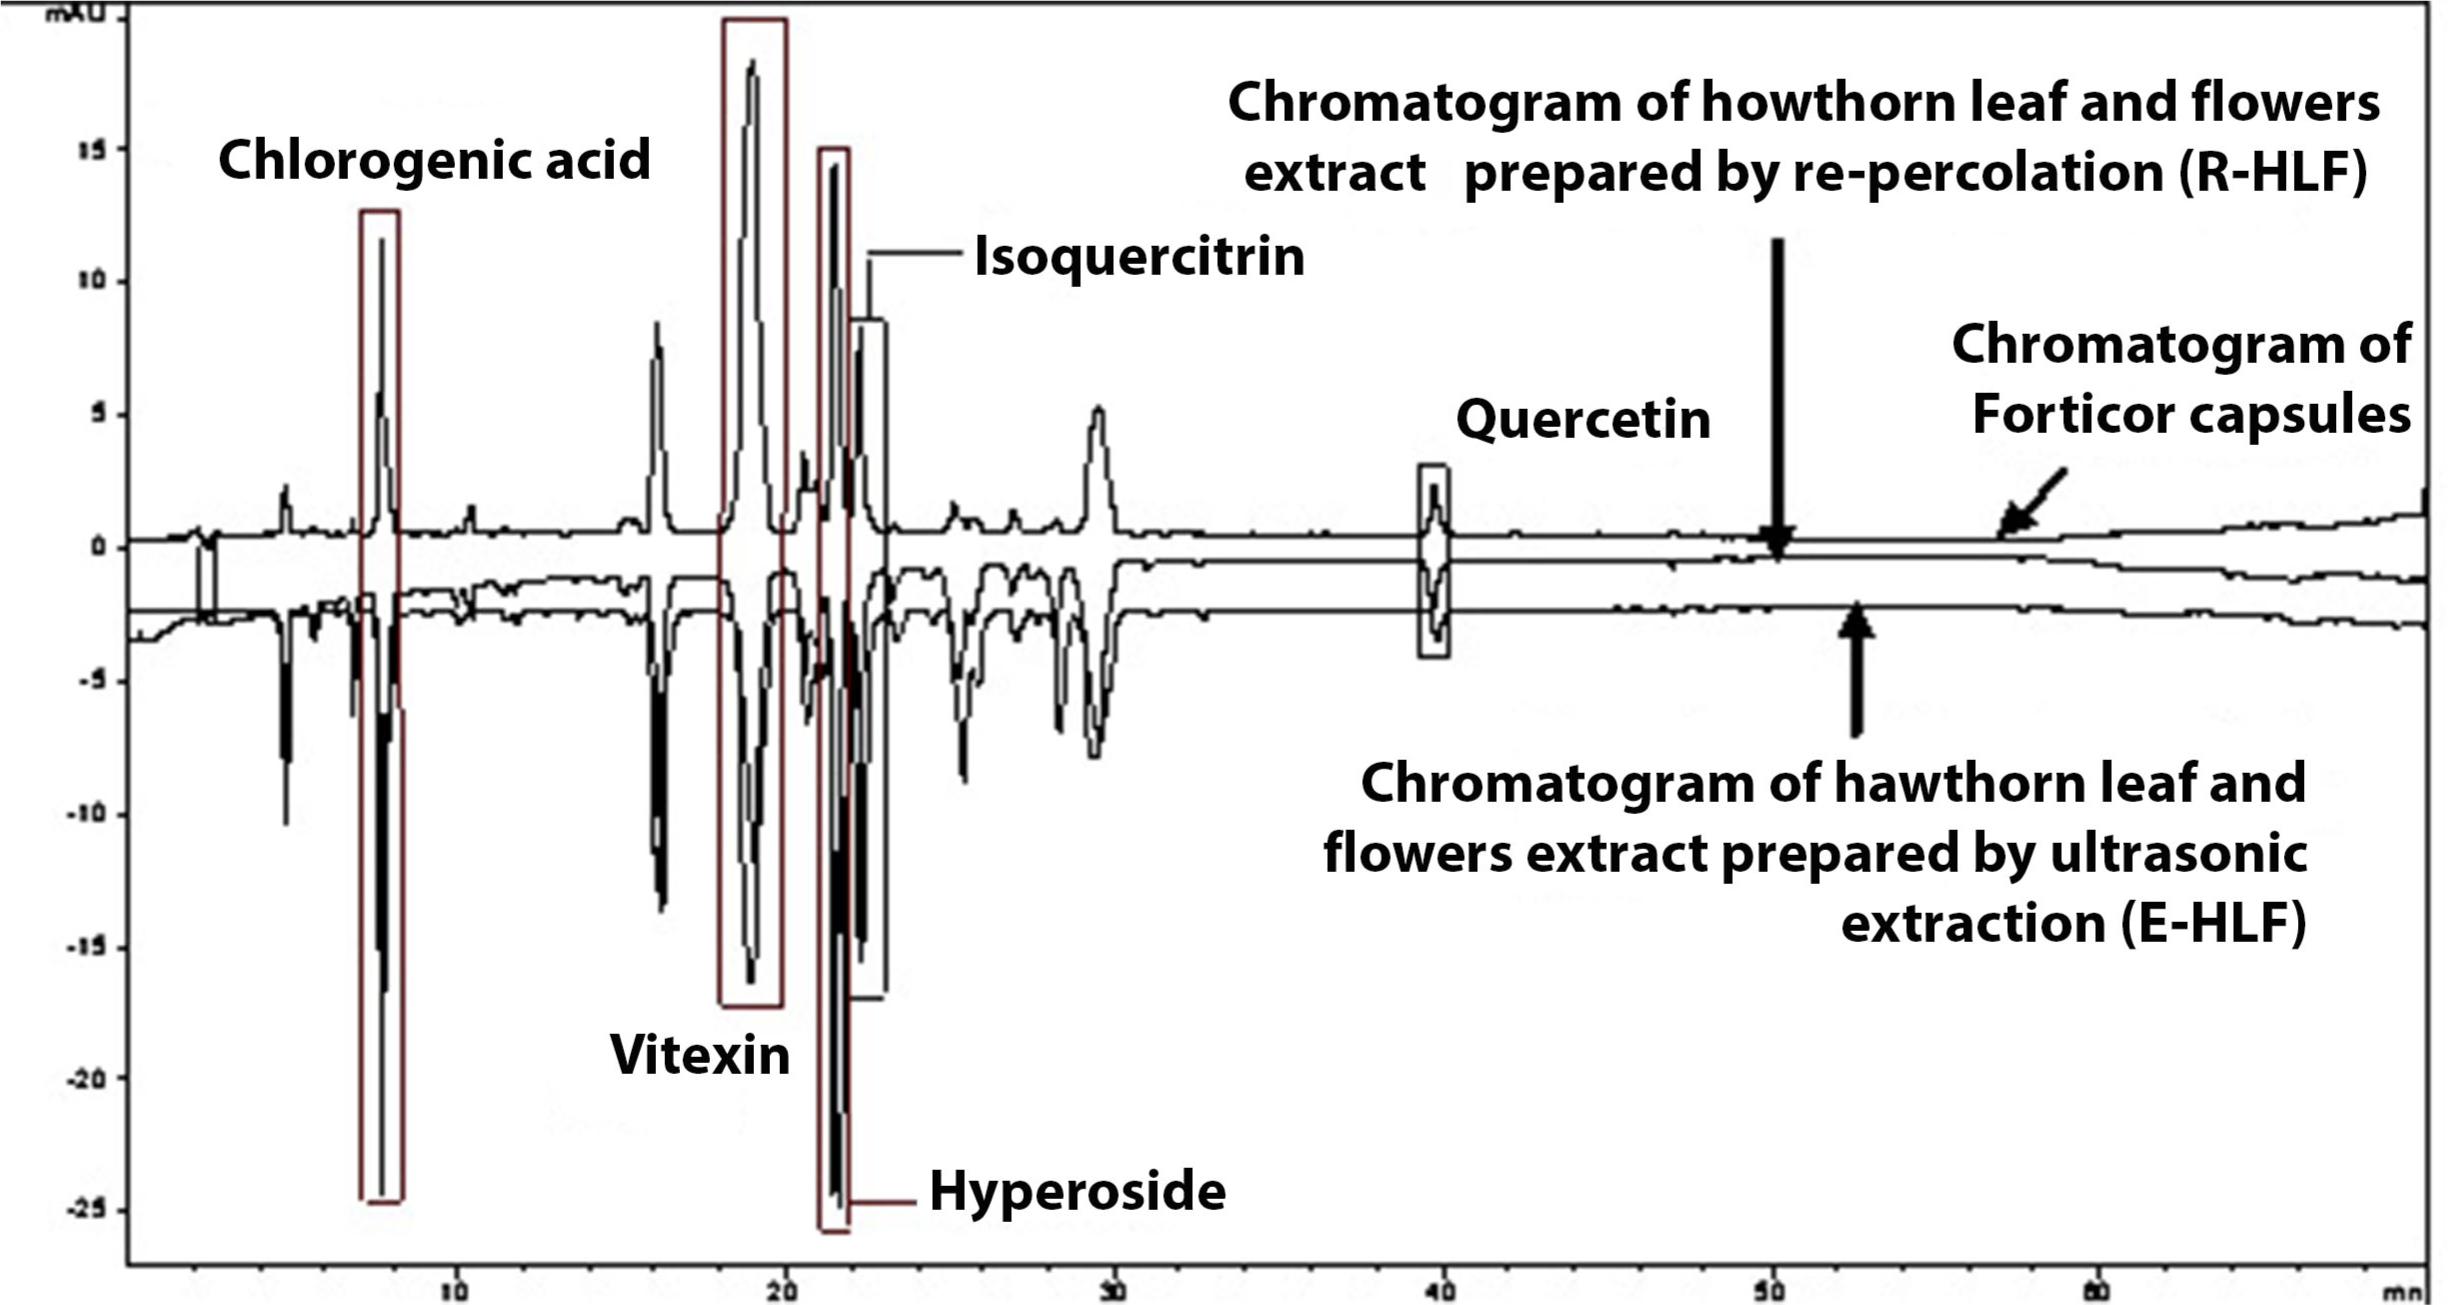
“Fingerprinting” of the investigated phenolic compounds was achieved by an Agilent Technologies 1200 HPLC machine, equipped with Lichrospher® 100 RP 18e column (5 μm, 250 x 4 mm), applying gradient elutions of two mobile phases, i.e., “A/B” (“A” – consisting of V/V 500.0 mL of water and 9.8 mL of 85% phosphoric acid, and “B” - being a pure acetonitrile) at flow-rates of 1 mL/min, with photodiode-array (PDA) detection (UV at 360 nm), always within 70 min. Gradient elution was 89 – 75 % A (0 - 35 min); 75 – 60 % A (35 - 55 min); 60 – 35 % A (55 - 60 min) and 35 – 0 % A (60 - 70 min). The injection volume of standard solutions, as well as of the tested sample extracts, was 4 μL. The identification was based on retention times and overlay curves. Quantification was performed by the external calibration with already mentioned/described standards. Final results were being confirmed by so-called peak purity tests, as shown in Figure 2 and Table 3.
2.7. Method validation
2.7.1. Scopes of the analyses
The limits of the detection (LOD) and limits of quantification (LOQ) for each of the target compounds were being determined over a period of three consecutive days. The “noise” and retention times for the analyzed unidentified compounds were recorded and integrated. The standard deviation and the average values were calculated and used for the estimation of the method’s LOD. The LOQ for each of the analytes was defined as the mean value, plus the ten standard deviations, calculated from the measured data, as shown in Table 1 and Table 3.
In accordance to the appropriate guideline, the limit of detection (LOD) for this assay was calculated as three times signal-to-noise ratio (S/N), while LOQ for this assay was calculated as ten times S/N level ( ICH Harmonised tripartite guideline: Validation of Analytical Procedures: Text and Methodology Q2(R1), 2014; Tadic et al., 2022).
2.7.2. Precision
For every tested sample, three people e.g., analysts, on three occasions, were engaged to collect the results - in three repetitions! Thus, in total, our analysts randomly ran a matrix of 15 experiments, over three-day periods during 5 business days of each week. Collected data were used to statistically determine the method’s precision. All 3 intra-day, inter-day values and the peak areas, were expressed as their relative standard deviations (RSDs), while also ascertained for the target four key flavonoids and a phenolcarboxylic acid, by multiple analyses, as shown in Table 2.
| Compound | Regression equation | Correlation coefficient (R) | Linear range (μg/ml) | Limit of detection (LOD) | Limit of quantification (LOQ) |
|---|---|---|---|---|---|
| (μg/ml) | (μg/ml) | ||||
| CA | y = 4.0230 x – 2.6612 | 0.9998 | 1.05 – 210.00 | 0.6 | 1.99 |
| V | y = 5.7946 x + 6.627 | 0.9994 | 6.25 – 250.00 | 0.5 | 1.66 |
| H | y = 7.3936 x – 19.206 | 0.9996 | 25.00 – 250.00 | 0.5 | 1.66 |
| IQ | y = 5.1396 x – 8.2439 | 0.9998 | 7.50 – 150.00 | 0.8 | 2.66 |
| Q | y = 10.895 x – 2.0348 | 0.9998 | 1.04 – 10.40 | 0.3 | 1 |
2.7.3. Accuracy
A spike recovery study was used to check the accuracy of the method. Three amounts (0.15, 0.30 and 0.45 mg) were tested in three repetitions for all analytes, except for quercetin which was diluted ten times (0.015, 0.030 and 0.045 mg), to make Samples I, II and III, respectively. For every single analyte, the recovery degree was calculated by dividing the actual with the expected value and multiplying it by 100. The recovery of all tested compounds, at each spike level, was then calculated along with the average and standard deviation.
2.7.4. Stability of standards
At the beginning of the validation, all reference materials were prepared, as described above in the section “Preparation of standards and creation of calibration curves”. To further confirm the stability of standards upon storing them, their fresh solutions were repeatedly prepared and checked again three weeks after the study begun. The concentrations were maintained at 100 μg/mL, with an exception, in the case of quercetin (5 μg/mL only), and the results were compared to data obtained after making their original/initial standard solutions, immediately upon receiving fine chemicals from the manufacturer.
3. RESULTS AND DISCUSSION
Identification of flavonoids (quercetin, isoquercitrin, hyperoside, vitexin) and phenolcarboxylic acid (chlorogenic acid), based on retention times and overlay curves with the appropriate standards, and further confirmed by so-called peak purity test is shown in Figure 1 and Figure 2.
Data regarding quantification of the investigated phenolics, obtained using calibration curves (Figure 3), are shown in Table 1.
Results regarding method validation are presented in the appropriate tables, namely limits of the detection (LOD) and limits of quantification (LOQ) are shown in Table 2, while method precision and accuracy are shown in Table 3.
| Component matrix | Method precision (% of relative standard deviation) | Method accuracy (% of spike recovery) | |||||||||
|---|---|---|---|---|---|---|---|---|---|---|---|
| CA | V | H | IQ | Q | Tested | CA | V | H | IQ | Q | |
| R-HLF | R-HLF | ||||||||||
| Day 1 | 1.19 | 1.17 | 0.88 | 1.09 | 0.63 | Sample I | 101.28 | 98.99 | 98.76 | 99.08 | 100.9 |
| Day 2 | 0.87 | 0.71 | 0.58 | 0.53 | 2.31 | Sample II | 99.16 | 99.21 | 101.4 | 98.98 | 100.99 |
| Day 3 | 0.35 | 0.52 | 0.21 | 0.42 | 0.18 | Sample III | 99.14 | 98.13 | 100.24 | 100.46 | 100.23 |
| Inter-day | 1.37 | 1.66 | 1.08 | 0.65 | 2.08 | ||||||
| E-HLF | E-HLF | ||||||||||
| Day 1 | 1.7 | 1.8 | 1.65 | 0.55 | 1.84 | Sample I | 100.65 | 100.65 | 100.09 | 100.2 | 101.71 |
| Day 2 | 1.89 | 0.57 | 0.59 | 0.37 | 1.04 | Sample II | 99.08 | 100.27 | 100.59 | 99.25 | 101.18 |
| Day 3 | 2.2 | 1.41 | 1.1 | 0.62 | 0.68 | Sample III | 100.05 | 100.76 | 100.47 | 100.26 | 101.5 |
| Inter-day | 1.25 | 1.22 | 1.82 | 0.43 | 0.71 | ||||||
| R-HB | R-HB | ||||||||||
| Day 1 | - | 1.73 | 1.33 | 1.2 | 1.33 | Sample I | - | - | 100.47 | 101.92 | 101.35 |
| Day 2 | - | 2.95 | 0.51 | 0.54 | 0.88 | Sample II | - | - | 100.49 | 100.3 | 101.35 |
| Day 3 | - | 1.71 | 0.83 | 0.88 | 0.39 | Sample III | - | - | 100.05 | 101.25 | 100.17 |
| Inter-day | - | 1.8 | 0.91 | 0.88 | 1.81 | ||||||
| E-HB | E-HB | ||||||||||
| Day 1 | - | - | 1.24 | 0.67 | 2.1 | Sample I | - | - | 98.25 | 99.03 | 100.44 |
| Day 2 | - | - | 2.36 | 0.01 | 1.92 | Sample II | - | - | 100.56 | 98.67 | 100.36 |
| Day 3 | - | - | 1.79 | 0.34 | 0.82 | Sample III | - | - | 100.81 | 101 | 101.12 |
| Inter-day | - | - | 0.32 | 0.17 | 0.85 | ||||||
| Component matrix | Method precision (% of relative standard deviation) | Method accuracy (% of spike recovery) | |||||||||
|---|---|---|---|---|---|---|---|---|---|---|---|
| CA | V | H | IQ | Q | Tested | CA | V | H | IQ | Q | |
| Forticor capsules | Forticor capsules | ||||||||||
| Day 1 | 1.45 | 1.67 | 1.84 | 1.94 | 1.7 | Sample I | 99.47 | 99.7 | 99.33 | 99.78 | 102.48 |
| Day 2 | 1.12 | 1.49 | 1.45 | 1.07 | 1.73 | Sample II | 99.31 | 99.71 | 98.04 | 100.53 | 100.2 |
| Day 3 | 1.82 | 1.92 | 1.75 | 1.95 | 1.42 | Sample III | 99.5 | 100.15 | 100.46 | 100.8 | 101.99 |
| Inter-day | 0.35 | 0.18 | 0.41 | 0.79 | 0.07 | ||||||
This paper referred to a relatively simple, but very reliable, newly developed, and validated one-step qualitative/quantitative HPLC analysis of four key flavonoids, and a phenolcarboxylic acid. During the course, for substrate/sample preparations, either triple percolations, using 70% ethanol-water (V/V), or/and ultrasonic bath methanol extractions, were carried out to obtain the desired isolates yielding quercetin, isoquercitrin, hyperoside, vitexin and chlorogenic acid. Thereby, triple percolation using 70% ethanolwater (V/V) was shown to extract higher yield of target compounds compared to ultrasonic bath methanol extraction in both hawthorn leaves and flowers as well as hawthorn berries (Table 1). The method is linear, over the studied range of 1.05 - 210.00, 6.25 - 250.00, 25.00 – 250.00, 7.50 – 150.00 and 1.04 - 10.40 μg/mL for chlorogenic acid, vitexin, hyperoside, isoquercitrin and quercetin, respectively. The correlation co-efficient for each of the analytes was greater than 0.999. The intra-day and inter-day precision of the analysis was below 2.00 and 3.00 %, respectively. The accuracy of the analysis was further verified by adding the fine chemicals, i.e. standards (in three different concentrations), to all tested materials, therefore applying a commonly accepted technique, which resulted in average recovery values obtained in the range between 98.04 - 102.47 % (RSD ≤ 1.85 %).
4. CONCLUSIONS
Bringing all of the above to a short conclusion, we firmly claim that one-step, e.g., at once, separations of quercetin, isoquercitrin, hyperoside, vitexin and chlorogenic acid in extracts of hawthorn leaves and flowers as well as hawthorn berries, obtained by two extraction procedures (triple percolation, using 70% ethanol-water (V/V) and ultrasonic bath methanol extraction) representing complex mixtures of a number of individual components. The established linearity, precision and accuracy of the developed and validated method also implied its applicability as a reliable quality test of commercially used cardiotonic Forticor® capsules (a trade mark in Serbia), as the basis for further investigations enabling potential clinical relevance of such multicomponent formulation for increasing/strengthening cardiac muscles, lowering the risks of atherosclerosis, hypertension and congestive heart failure.